1
2
3
4
5
6
7
8
9
10
11
12
13
14
15
16
17
18
19
20
21
22
23
24
25
26
27
28
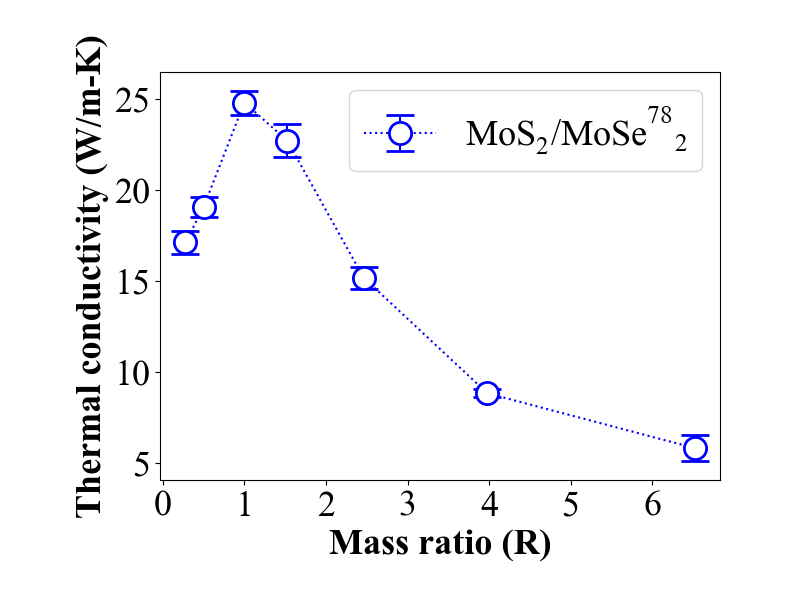
| import numpy as np
import matplotlib.pyplot as plt
def plt_tc(tcfile):
tc = np.loadtxt(tcfile)
x = tc[:,0]/32.06
y = tc[:,1:4]
y_mean = np.mean(y,axis=1)
y_std = np.std(y,axis=1)
plt.rc('font',family='Times New Roman',size=26)
fig, ax = plt.subplots(figsize=(8,6))
fig.subplots_adjust(bottom=0.2,left=0.2)
s1 = ax.errorbar(x,y_mean,yerr=y_std,capsize=10,capthick=4,
fmt='bo:',mfc='w',mec='b',markersize=16,mew=2)
ax.legend(handles=[s1],labels=['$\mathregular{MoS_2}$/$\mathregular{MoSe^{78}}_\mathregular{2}$']
,loc='best', fontsize=26)
ax.set_xlabel('Mass ratio (R)',fontsize=26,fontweight='bold')
ax.set_ylabel('Thermal conductivity (W/m-K)',fontsize=26,fontweight='bold')
ax.set_xticks([0,1,2,3,4,5,6])
plt.show()
return
if __name__ == '__main__':
tcfile = './Thermal_conductivity.txt'
plt_tc(tcfile)
|
