Eastsheng's Wiki

Matplotlib基本-2

2021-11-10 16:31:28

[toc]

Legend一般常用属性

1. loc

1
2
import numpy as np 
import matplotlib.pyplot as plt
Location String Location Code
‘best’ 0
‘upper right’ 1
‘upper left’ 2
‘lower left’ 3
‘lower right’ 4
‘right’ 5
‘center left’ 6
‘center right’ 7
‘lower center’ 8
‘upper center’ 9
‘center’ 10

2. bbox_to_anchor

  • 将Legend放置任意指定位置;
  • 两种方法
    • bbox_to_anchor=(x, y, width, height)
    • bbox_to_anchor=(x, y)
1
2
plt.legend(loc="best",bbox_to_anchor=(0.5, 0., 0.5, 0.5))
plt.legend(loc="best",bbox_to_anchor=(0.5, 0.5))

3. ncol

  • 图例的列数,默认为1
    1
    plt.legend(loc="best",ncol=1)

3. shadow

  • 图例阴影
    1
    plt.legend(loc="best",shadow=True)

4. 简单例子

1
2
3
4
5
6
7
8
9
10
11
12
13
14
15
16
17
18
19
20
21
22
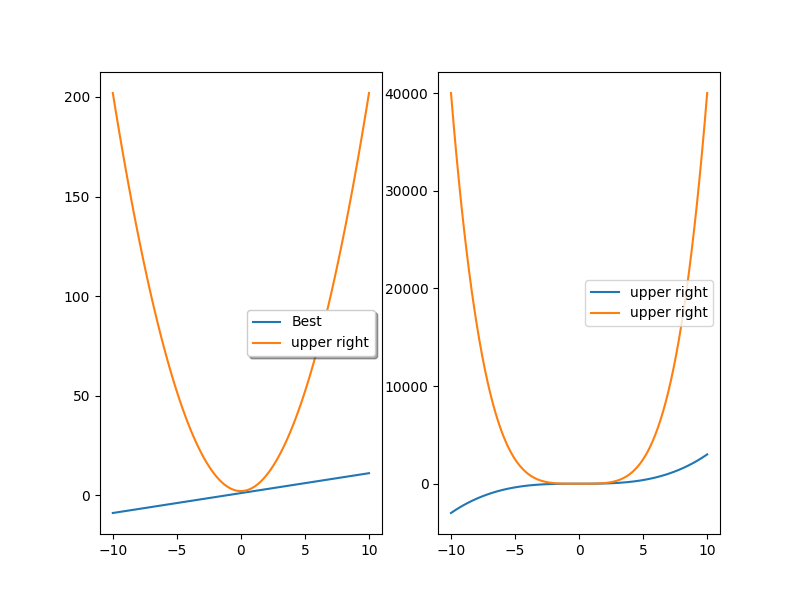
import numpy as np 
import matplotlib.pyplot as plt

x = np.linspace(-10,10,100)
y1 = x**1+1
y2 = 2*x**2+2
y3 = 3*x**3+3
y4 = 4*x**4+4

fig = plt.figure(figsize=(8,6))
ax1 = fig.add_subplot(121)
ax1.plot(x,y1,label="Best")
ax1.plot(x,y2,label="upper right")
plt.legend(loc="best",bbox_to_anchor=(0.5, 0., 0.5, 0.5),
ncol=1,shadow=True)

ax2 = fig.add_subplot(122)
ax2.plot(x,y3,label="upper right")
ax2.plot(x,y4,label="upper right")

plt.legend(loc="center right")
plt.show()

参考链接

[1]. https://matplotlib.org/stable/api/_as_gen/matplotlib.pyplot.legend.html

Matplotlib 双轴

设置双轴

1
ax2 = ax1.twinx() # this is the important function

设置轴颜色

  • tick颜色
1
ax1.tick_params(axis='y',colors='black') # this is the important function
  • label颜色
1
2
ax2.xaxis.label.set_color('black') # this is the important function about label color
ax2.yaxis.label.set_color('red') # this is the important function about label color

完整代码

1
2
3
4
5
6
7
8
9
10
11
12
13
14
15
16
17
18
19
20
21
22
23
24
25
import matplotlib.pyplot as plt
import numpy as np
# 双轴+坐标轴颜色
x = np.arange(0, 1, 0.01)
y1 = x**(1)
y2 = x**(-0.1)

plt.rc('font', family='Times New Roman', size=22)
fig = plt.figure(figsize=(12, 10))
ax1 = fig.add_subplot(111)
ax1.plot(x, y1,'r',label="red")
ax1.legend(loc="upper left")
ax1.set_xlim([0, 1])
ax1.set_ylabel('Left')
ax1.set_xlabel('X')
# ax1.tick_params(axis='y',colors='black') # this is the important function

ax2 = ax1.twinx() # this is the important function

ax2.plot(x, y2, 'g',label = "green")
ax2.legend(loc="upper right")
ax2.set_ylabel('Right')
ax2.tick_params(axis='y',colors='red') # this is the important function about tick color
ax2.yaxis.label.set_color('red') # this is the important function about label color
plt.show()

边框颜色、宽度

1
2
3
4
ax.spines['top'].set_color('red')
ax.spines['bottom'].set_color('none') # 无色
ax.spines['left'].set_linewidth(2)
ax.spines['right'].set_linewidth(2)

参考

matplotlib_bar

1
2
3
4
5
6
7
8
9
10
11
12
13
14
15
16
17
18
19
20
21
22
23
24
25
26
27
28
29
30
31
32
33
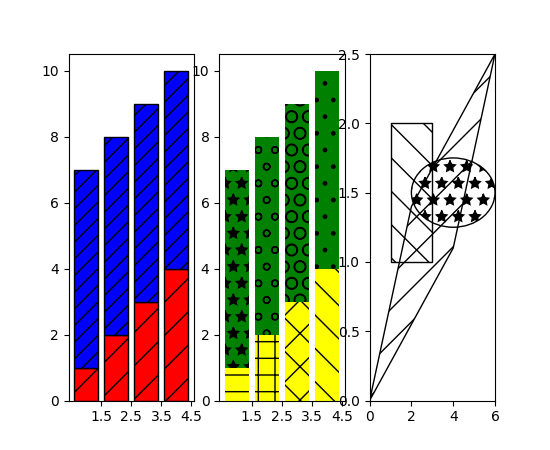
"""
Hatching (pattern filled polygons) is supported currently in the PS,
PDF, SVG and Agg backends only.
"""
import matplotlib.pyplot as plt
from matplotlib.patches import Ellipse, Polygon

fig = plt.figure()
ax1 = fig.add_subplot(131)
ax1.bar(range(1, 5), range(1, 5), color='red', edgecolor='black', hatch="/")
ax1.bar(range(1, 5), [6] * 4, bottom=range(1, 5), color='blue', edgecolor='black', hatch='//')
ax1.set_xticks([1.5, 2.5, 3.5, 4.5])

ax2 = fig.add_subplot(132)
bars = ax2.bar(range(1, 5), range(1, 5), color='yellow', ecolor='black') + \
ax2.bar(range(1, 5), [6] * 4, bottom=range(1, 5), color='green', ecolor='black')
ax2.set_xticks([1.5, 2.5, 3.5, 4.5])

##{'/', '\', '|', '-', '+', 'x', 'o', 'O', '.', '*'}
patterns = ('-', '+', 'x', '\\', '*', 'o', 'O', '.')

for bar, pattern in zip(bars, patterns):
bar.set_hatch(pattern)

ax3 = fig.add_subplot(133)
ax3.fill([1, 3, 3, 1], [1, 1, 2, 2], fill=False, hatch='\\')
ax3.add_patch(Ellipse((4, 1.5), 4, 0.5, fill=False, hatch='*'))
ax3.add_patch(Polygon([[0, 0], [4, 1.1], [6, 2.5], [2, 1.4]], closed=True,
fill=False, hatch='/'))
ax3.set_xlim((0, 6))
ax3.set_ylim((0, 2.5))

plt.show()

Maplotlib坐标轴反转

1
2
ax.invert_xaxis()
ax.invert_yaxis()

坐标轴LOG

1
2
3
4
ax.set_xscale("log", base = 10)
ax.set_yscale("log", base = 10)
plt.xscale("log", base = 10)
plt.yscale("log", base = 10)

savefig

1
plt.savefig('xxx.tiff',dpi=300,transparent=True)

Seaborn