[toc]
Networkx
一个用来创建、操作和研究复杂网络结构的 Python 库
Installation
1 | pip install networkx # 安装最新版 |
Examples
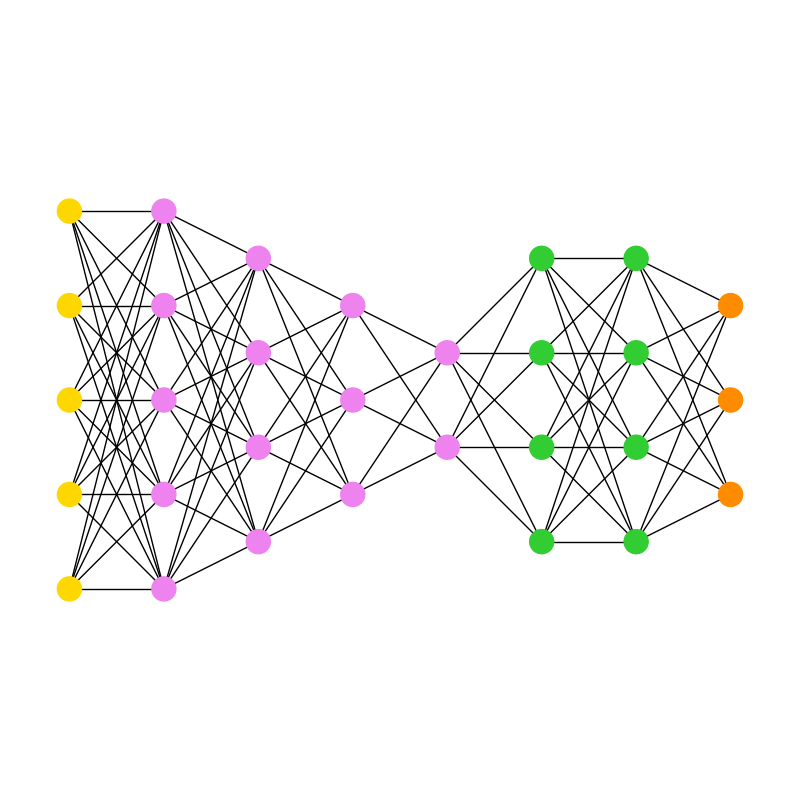
Multipartite Layout:
1
2
3
4
5
6
7
8
9
10
11
12
13
14
15
16
17
18
19
20
21
22
23
24
25
26
27
28
29
30
31
32
33
34import itertools
import matplotlib.pyplot as plt
import networkx as nx
subset_sizes = [5, 5, 4, 3, 2, 4, 4, 3]
subset_color = [
"gold",
"violet",
"violet",
"violet",
"violet",
"limegreen",
"limegreen",
"darkorange",
]
def multilayered_graph(*subset_sizes):
extents = nx.utils.pairwise(itertools.accumulate((0,) + subset_sizes))
layers = [range(start, end) for start, end in extents]
G = nx.Graph()
for i, layer in enumerate(layers):
G.add_nodes_from(layer, layer=i)
for layer1, layer2 in nx.utils.pairwise(layers):
G.add_edges_from(itertools.product(layer1, layer2))
return G
G = multilayered_graph(*subset_sizes)
color = [subset_color[data["layer"]] for v, data in G.nodes(data=True)]
pos = nx.multipartite_layout(G, subset_key="layer")
plt.figure(figsize=(8, 8))
nx.draw_networkx(G, pos, node_color=color, with_labels=False)
plt.axis("equal")
plt.show()
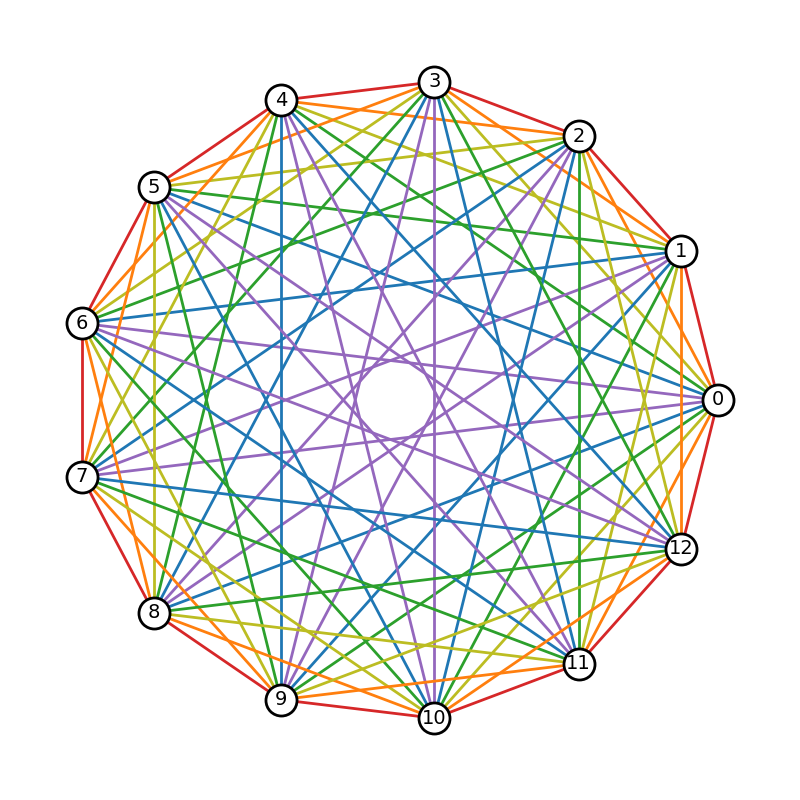
Rainbow Coloring:
1
2
3
4
5
6
7
8
9
10
11
12
13
14
15
16
17
18
19
20
21
22
23
24
25
26
27
28
29
30
31
32
33
34
35
36
37
38
39
40
41
42
43
44
45
46
47
48
49import matplotlib.pyplot as plt
import networkx as nx
# A rainbow color mapping using matplotlib's tableau colors
node_dist_to_color = {
1: "tab:red",
2: "tab:orange",
3: "tab:olive",
4: "tab:green",
5: "tab:blue",
6: "tab:purple",
}
# Create a complete graph with an odd number of nodes
nnodes = 13
G = nx.complete_graph(nnodes)
# A graph with (2n + 1) nodes requires n colors for the edges
n = (nnodes - 1) // 2
ndist_iter = list(range(1, n + 1))
# Take advantage of circular symmetry in determining node distances
ndist_iter += ndist_iter[::-1]
def cycle(nlist, n):
return nlist[-n:] + nlist[:-n]
# Rotate nodes around the circle and assign colors for each edge based on
# node distance
nodes = list(G.nodes())
for i, nd in enumerate(ndist_iter):
for u, v in zip(nodes, cycle(nodes, i + 1)):
G[u][v]["color"] = node_dist_to_color[nd]
pos = nx.circular_layout(G)
# Create a figure with 1:1 aspect ratio to preserve the circle.
fig, ax = plt.subplots(figsize=(8, 8))
node_opts = {"node_size": 500, "node_color": "w", "edgecolors": "k", "linewidths": 2.0}
nx.draw_networkx_nodes(G, pos, **node_opts)
nx.draw_networkx_labels(G, pos, font_size=14)
# Extract color from edge data
edge_colors = [edgedata["color"] for _, _, edgedata in G.edges(data=True)]
nx.draw_networkx_edges(G, pos, width=2.0, edge_color=edge_colors)
ax.set_axis_off()
fig.tight_layout()
plt.show()
References
- [1] Network Analysis in Python.
